Visualize-AR
Transforming Data Into Actionable Insights
Experience dynamic data visualization in augmented reality—designed to empower smarter decisions
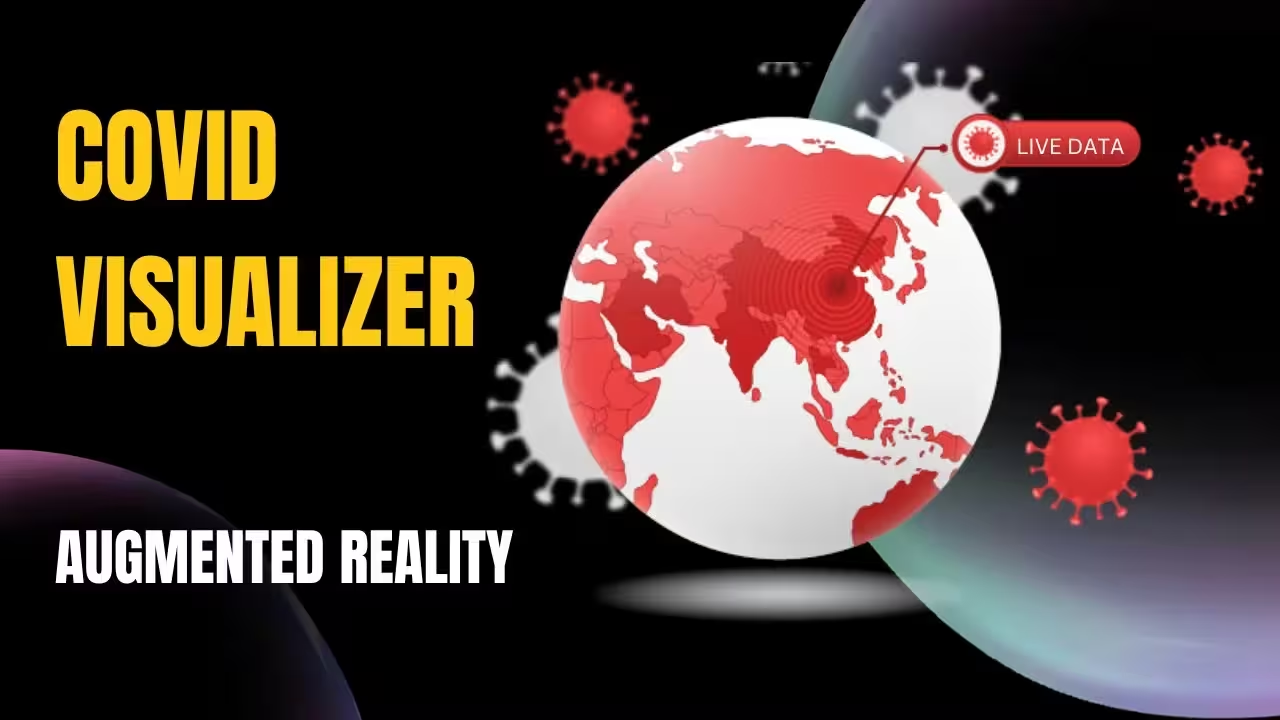
Visualize - AR : Augmented Visualization
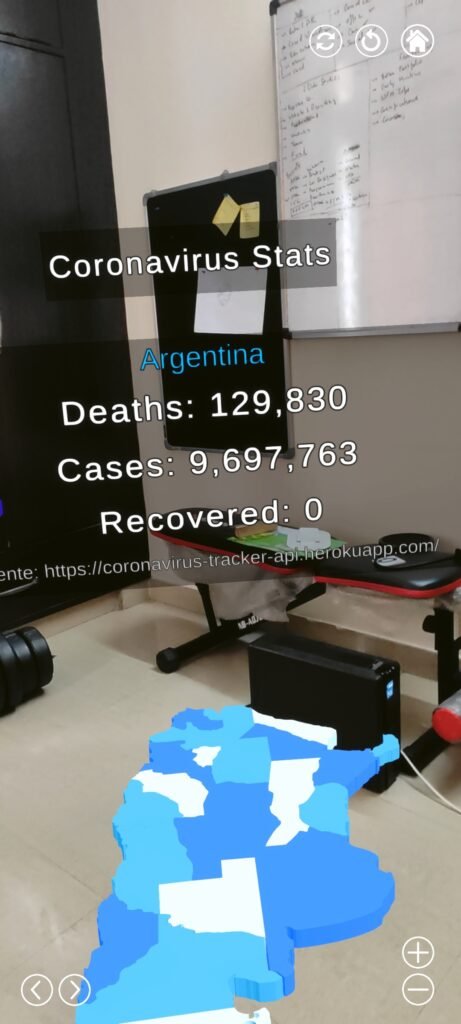
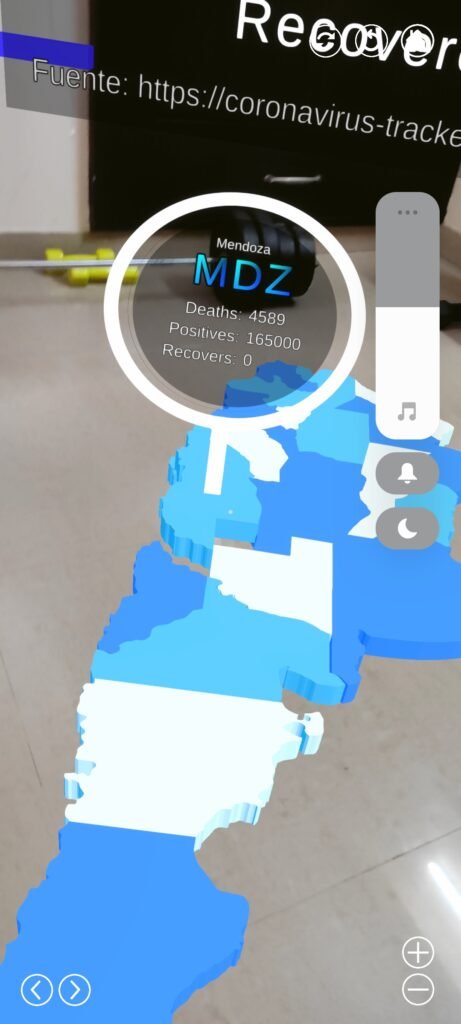
“Augmented Visualization” revolutionizes how businesses interact with data by integrating immersive augmented reality (AR) with dynamic visualization techniques. Empower your decision-making with real-time, intuitive insights through 3D graphs, heatmaps, and interactive dashboards.
Tech Stack
- ARCore, ARKit, WebXR
- Unity, Three.js
- Pandas, NumPy
- Node.js, Django
- PostgreSQL, Firebase
- REST APIs, WebSockets
- Unity Build, WebGL
Why Choose Visualize-AR?
From Blueprints to Reality: Transform Your Vision into Immersive Experiences
The Visualize-AR Use Case
1. Data Processing
Real-time data is processed using Python and Pandas
2. Visualization Creation
Data is transformed into 3D visualizations in Unity
3. AR Display
Visualizations are rendered using ARCore, ARKit, or WebAR
4. Interaction
Users can zoom, filter, and interact with data directly in AR


Visualize AR Benefits
Smarter Decisions
Enhance data comprehension with intuitive AR visuals
Improved Collaboration
Share visualizations in real-time AR spaces for seamless team discussions
Increased Efficiency
Reduce analysis time and focus on actionable insights
Collaboration Ready
Photon networking for real-time walkthroughs


See Your Data Like Never Before
Experience dynamic data visualization in augmented reality—designed to empower smarter decisions
- AR Frameworks: ARCore, ARKit, WebXR
- Visualization Tools: Unity, Three.js
- Data Processing: Pandas, NumPy
- Databases: PostgreSQL, Firebase
- Networking: REST APIs, WebSockets
- Cross-Platform Compatibility: Unity Build, WebGL
- Programming Languages: Python, C#
- Data Processing: Pandas, NumPy
FAQ
What devices are supported for AR/VR experiences?
How do I upload my project blueprints?
Is this platform suitable for large-scale projects?
Results
- 40% improvement in data interpretation accuracy
- 25% increase in collaborative analysis sessions
- 15% boost in revenue for pilot organizations
Future Enhancements
- AI-driven predictive insights
- Wearable AR compatibility with devices like HoloLens
- Gamification elements for engaging data exploration
BOOK A MEETING


